Helping people to analyze COVID-19 situation in their city

2020 was the year when India first witnessed the community outbreak of the SARS-COV-2 virus AKA COVID-19. Though, around late 2020, the dropping number of fresh COVID-19 cases made us all believe we have finally won the battle & things will go back to normal by 2021 & our guards went down.
Little did we know the battle has just begun!
2021 has been anticlimactic given where we stand at the moment. The virus is not only deadly but also spreading at ~4x speed when compared with 2020. Hospitals are full, medicines are in scarce supply, people panicking & what not. Amidst all this chaos, there’s an important question to ask i.e.
Can the data come to rescue?
In a quest to answer this, we at 1mg, India’s biggest healthcare platform, deep dived in the data repositories we own to figure out can we bring in some sort of inference out of it.But before that, we would like to answer the question that many of you may have i.e.
How can a healthcare platform’s data assist with the ongoing pandemic?
The data we own revolves majorly around healthcare & can give major insights about the health condition prevailing in our country. As mentioned earlier, being India’s biggest digital healthcare platform, we do have a reasonable presence across the country making our data sufficient and reliable for any sort of analysis.Moving on,The major directions we are exploring right now are:
- Search trends on 1mg: Data around search patterns of products/meds related to ‘fever’, ‘steroids’, ‘oximeters’, etc. associated with COVID-19
- Page views : Page views for products associated with COVID-19
- Labs Diagnostics: 1mg has been conducting RT-PCR tests at a rapid pace in some major cities in India for a long time now. Also, this can be put onto study COVID-19 effect at different levels like age, gender and demographics
- Others: Online doctor consultations alongside e-prescription can also come in handy
We, after considering all the above data points with different weights, coined a term ‘COVID Activity’ and will be used for further reference throughout the post . After some deep dive analysis, we figured that the surge for most of the cities related to ‘COVID Activity’ on 1mg app looks almost identical to fresh COVID-19 cases getting reported officially. Do observe the below graphs:
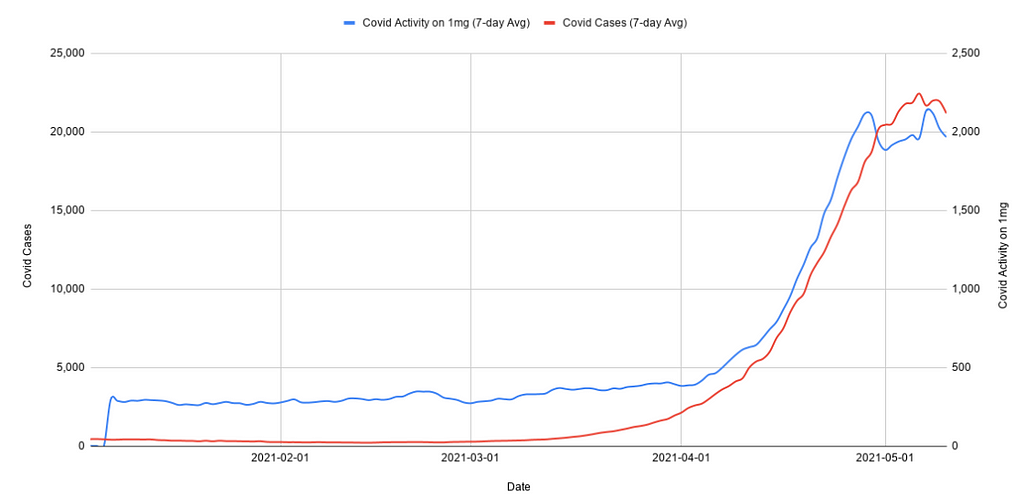
 Bangalore (Left) & Mysore (Right)
In the above graphs, The blue line refers to 1mg search volume & the red line refers to the official fresh COVID-19 cases in respective cities. As observed, the curves for Bangalore & Mysore seem to take the same inclination rate & settling on almost the same peak as search volume on 1mg for the respective cities.This is really interesting!
All this is is cool, but where can one see these analysis?
Recently, we launched ‘COVID-19 Snapshot’
where one can discover
- Cities with an Uptrend (increasing COVID-19 cases) overtime
- Cities with a Downtrend (decreasing COVID-19 cases) overtime
- A dropdown option for users to choose & analyze the current situation in their city. Though, this is available for ~90 cities for now but we will be adding a few more soon
But why is ‘COVID-19 Snapshot’ important?From our perspective:
- Monitoring: The common folk should have an idea about what is status in their city and accordingly take precautions
- Supply Chain Availability: May help online & offline stores to maintain their inventories/stocks depending on the cities they cater to. This will help in avoiding any type of scarcity
- Academics/Research: May help fellow researchers to take some strong strides in COVID-19 related researches
But why not Google search trends?
The answer is quite straight as Google search trends will capture the general public sentiment & hence prone to noise. For example: A commoner who sees something on news, goes straight to google to know more about it. Such activities where a person, out of curiosity, searched something related to COVID-19 will also add unto the search volume & there is no way we can distinguish whether the user is actually affected or not.On the other hand, 1mg’s COVID Activity data should be less prone to noise as our data would be more specific to people who actually require medication & hence end up landing on the platform.ObservationsThe graphs can give a lot of information about the ongoing crisis across the country. A few key observations our team chalked out are :
- Some major cities like Mumbai & Delhi may have passed the peak & should show some decline in daily fresh cases
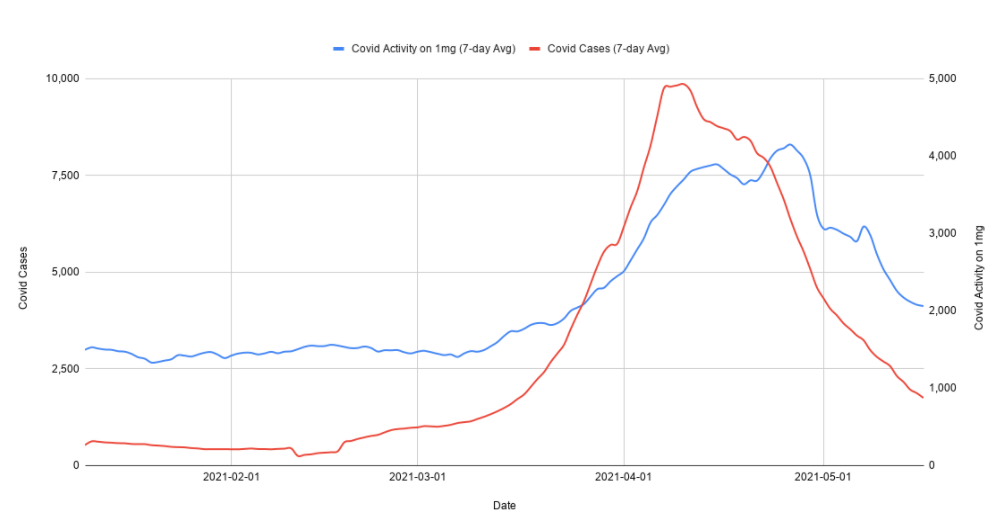
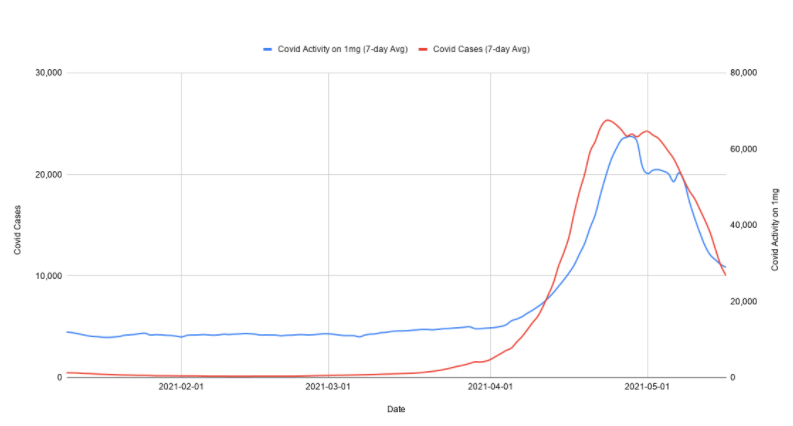 Mumbai (left) & New Delhi (right)
- The Southern & Eastern India may see a rapid inclination in coming days (so be alert!)
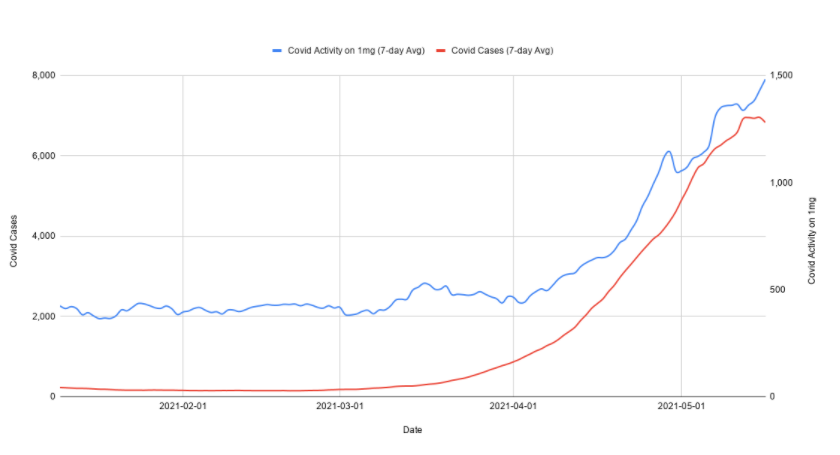
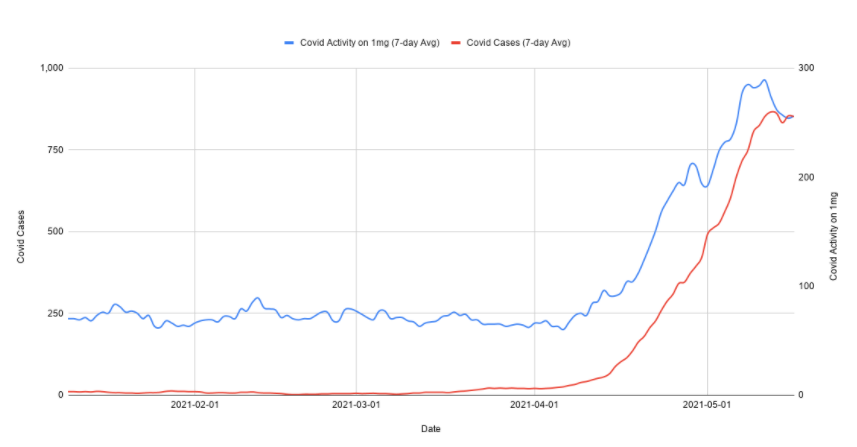 Chennai (left) & Cuttack (right)
- Northern India is also showing positive down trends with rapid declination in fresh cases in major cities of UP

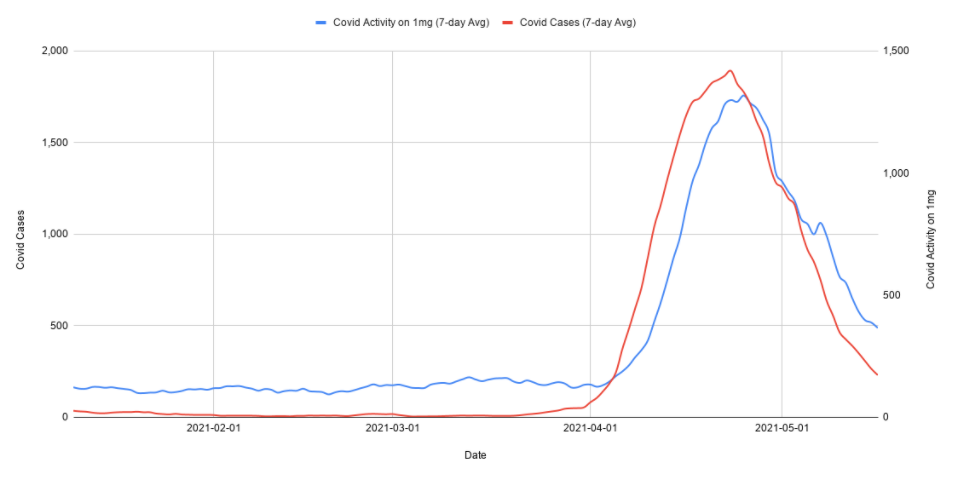 Agra (left) & Prayagraj (right)
Disclaimer: We don’t make any strict statement or prediction regarding COVID-19 but just presenting the current data patterns evident on our app.And that’s not all, we recently joined hands with the PathCheck Foundation assisting our efforts to fightback COVID-19, the data way. Do go through the below video where we have discussed our ongoing analysis around
- The correlation between search volumes of different medicine types and what it indicates about the severity of COVID-19
- How COVID-19 spread in India using heatmaps
- Surge in ‘fever’ and related keywords on the platform that correlates with the fresh cases getting reported in India
Soon, we will be adding a few more features to this space which may include stats around how the second wave is spreading in India using heatmaps, different age groups getting infected, gender wise infection rate & a lot more.
Stay tuned & do check out COVID-19 Snapshot now!
Contributors: Ayush Srivastava, Utkarsh Gupta, Rajat Jain, Harsh Sahu, Nitai Agarwal, Mehul Gupta
Introducing COVID-19 Snapshot was originally published in Tata 1mg Engineering on Medium, where people are continuing the conversation by highlighting and responding to this story.
- Log in to post comments
